Transforming financial reporting to improve performance
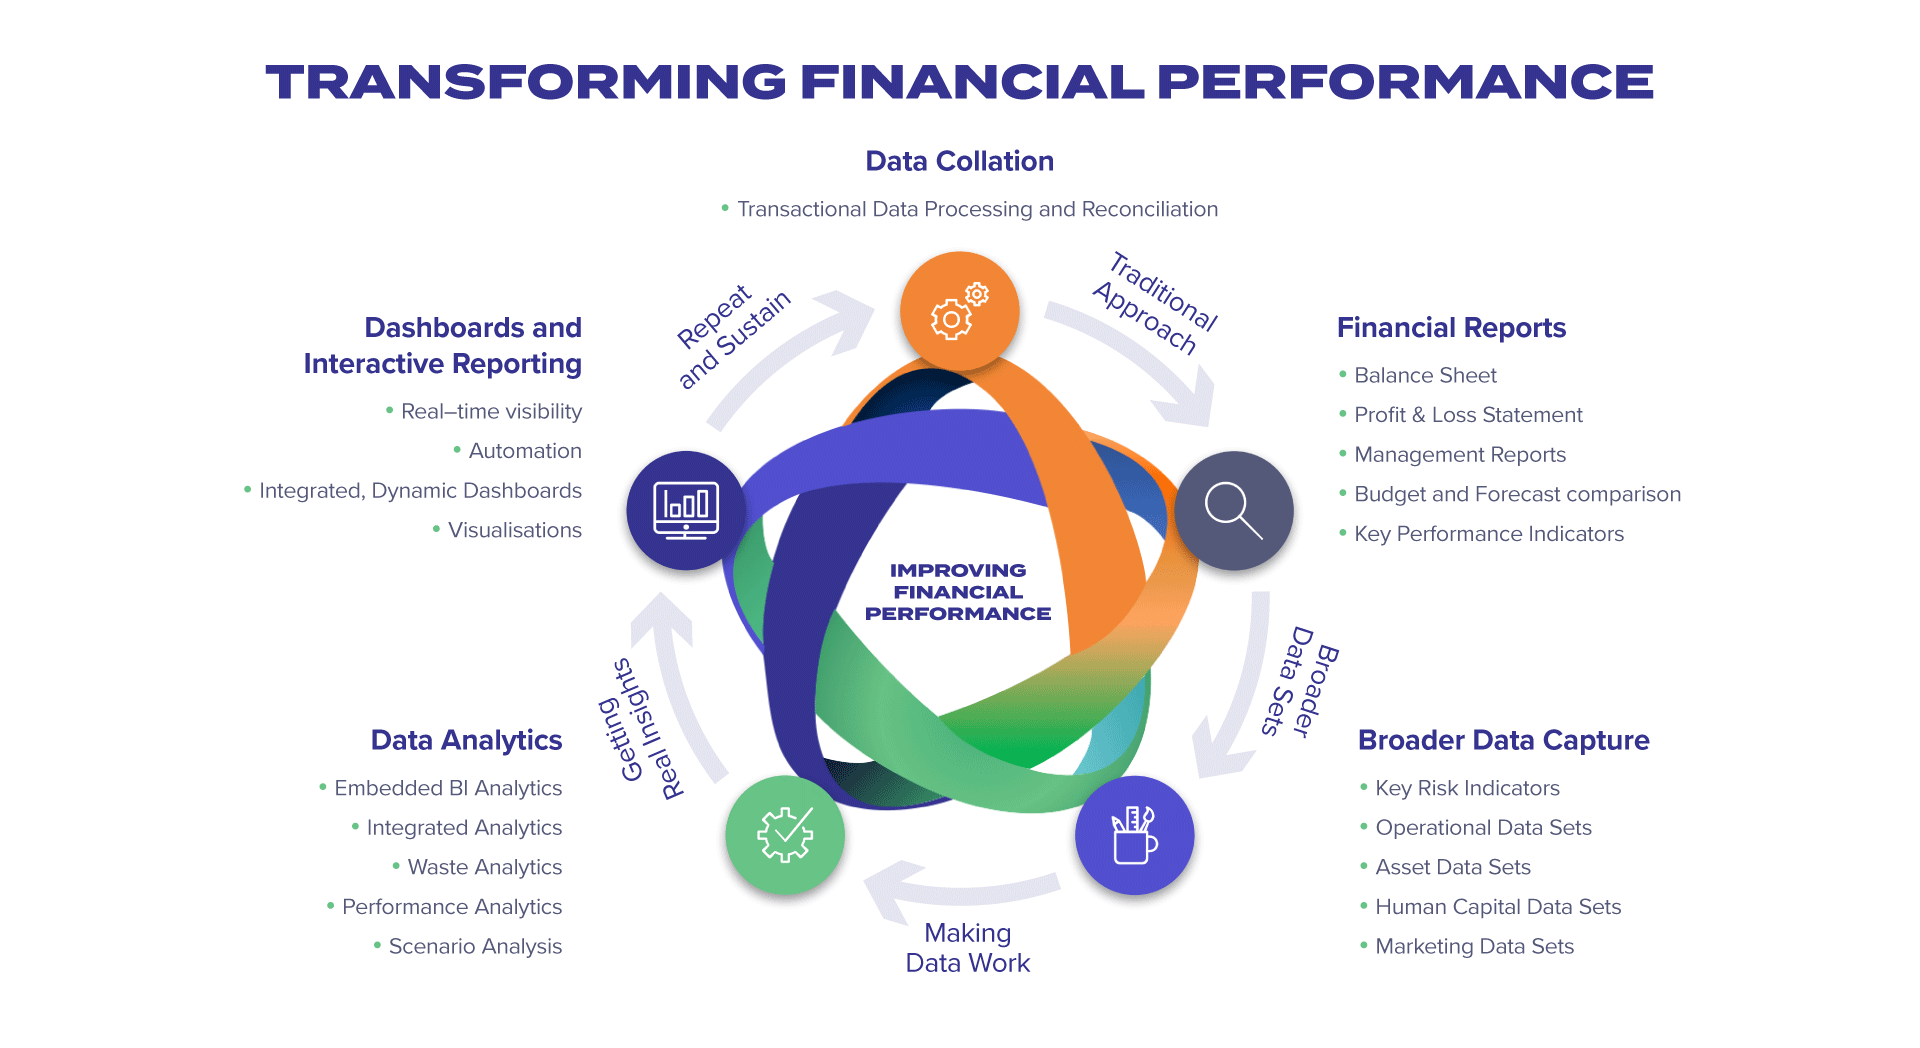
Qualified and experienced finance personnel produce these reports because that is what they have always done. The collation of data has centred around the processing and reconciliation of transactional data. The outcome of this is the production of typical management reports including the Balance Sheet, Income Statement and Profit and Loss Statement: reports that have remained relatively unchanged for decades.

The problem is the world has changed and is continuing to evolve. More than 90% of the world’s data has been created in the past 3 years. According to IBM, more data has been created during this time than in the entire history of the human race.
Organisations are producing and receiving more data and information than ever before, however financial reporting remains the same. Moving from these limited insights to a more informed position involves a mind-set change and significant transformation in how finance teams work.
What does a more informed position look like?
Boards and management, when planning, making decisions and/or discharging their governance obligations, should be provided with more than just historical information and linear forecasts. Directors and executives should be looking at interactive, real-time dashboards, forecasts involving scenarios, and historical information that can be drilled into for answers.

- inform how the business is actually performing;
- indicate how performance may be improved;
- highlight trends, issues or opportunities; and
- enable good financial governance, strategy, business model and operational decisions.
How do we achieve this informed position?
Our approach to transforming financial reporting to improve performance involves a systematic approach to identifying and collecting broader data sets for analysis.
Organisations produce a multitude of data which is not always effectively utilised to gain valuable insights. Broader data sets including, but not limited to, operations, assets, human capital and marketing can be captured and analysed to make an organisation’s data work.
Finance teams adopting data analytics is the key to making data work and getting real insights.
What are the benefits?
Transformed financial reporting produces ‘a perspective that helps leaders make important decisions in a risk-controlled manner. In other words, they use data to minimize the chance that you’ll come to an unwise conclusion’ (Harvard, 2019).
- Strategic planning
- Capacity planning
- Resource planning
- Asset performance
- CAPEX planning
- R&D planning
- Investment analysis and planning
- Product lifecycle planning
- Customer insights and interactions
- Innovation opportunities
- Improvement opportunities

Put simply, directors and management have access to the right information, at the right time to solve the right problems and pursue the right opportunities.
As 2020 approaches, can you afford not to have 20:20 visibility of organisational performance? Talk to us about how we can help transform your financial reporting to improve performance.
